Reported evidence.
SK hynix announced FY2025 revenue of KRW 97.1467 trillion and operating profit of KRW 47.2063 trillion. It reported that HBM revenue more than doubled year on year. These are preliminary consolidated results, not a standalone HBM income statement.
1. SK hynix / FY2025 results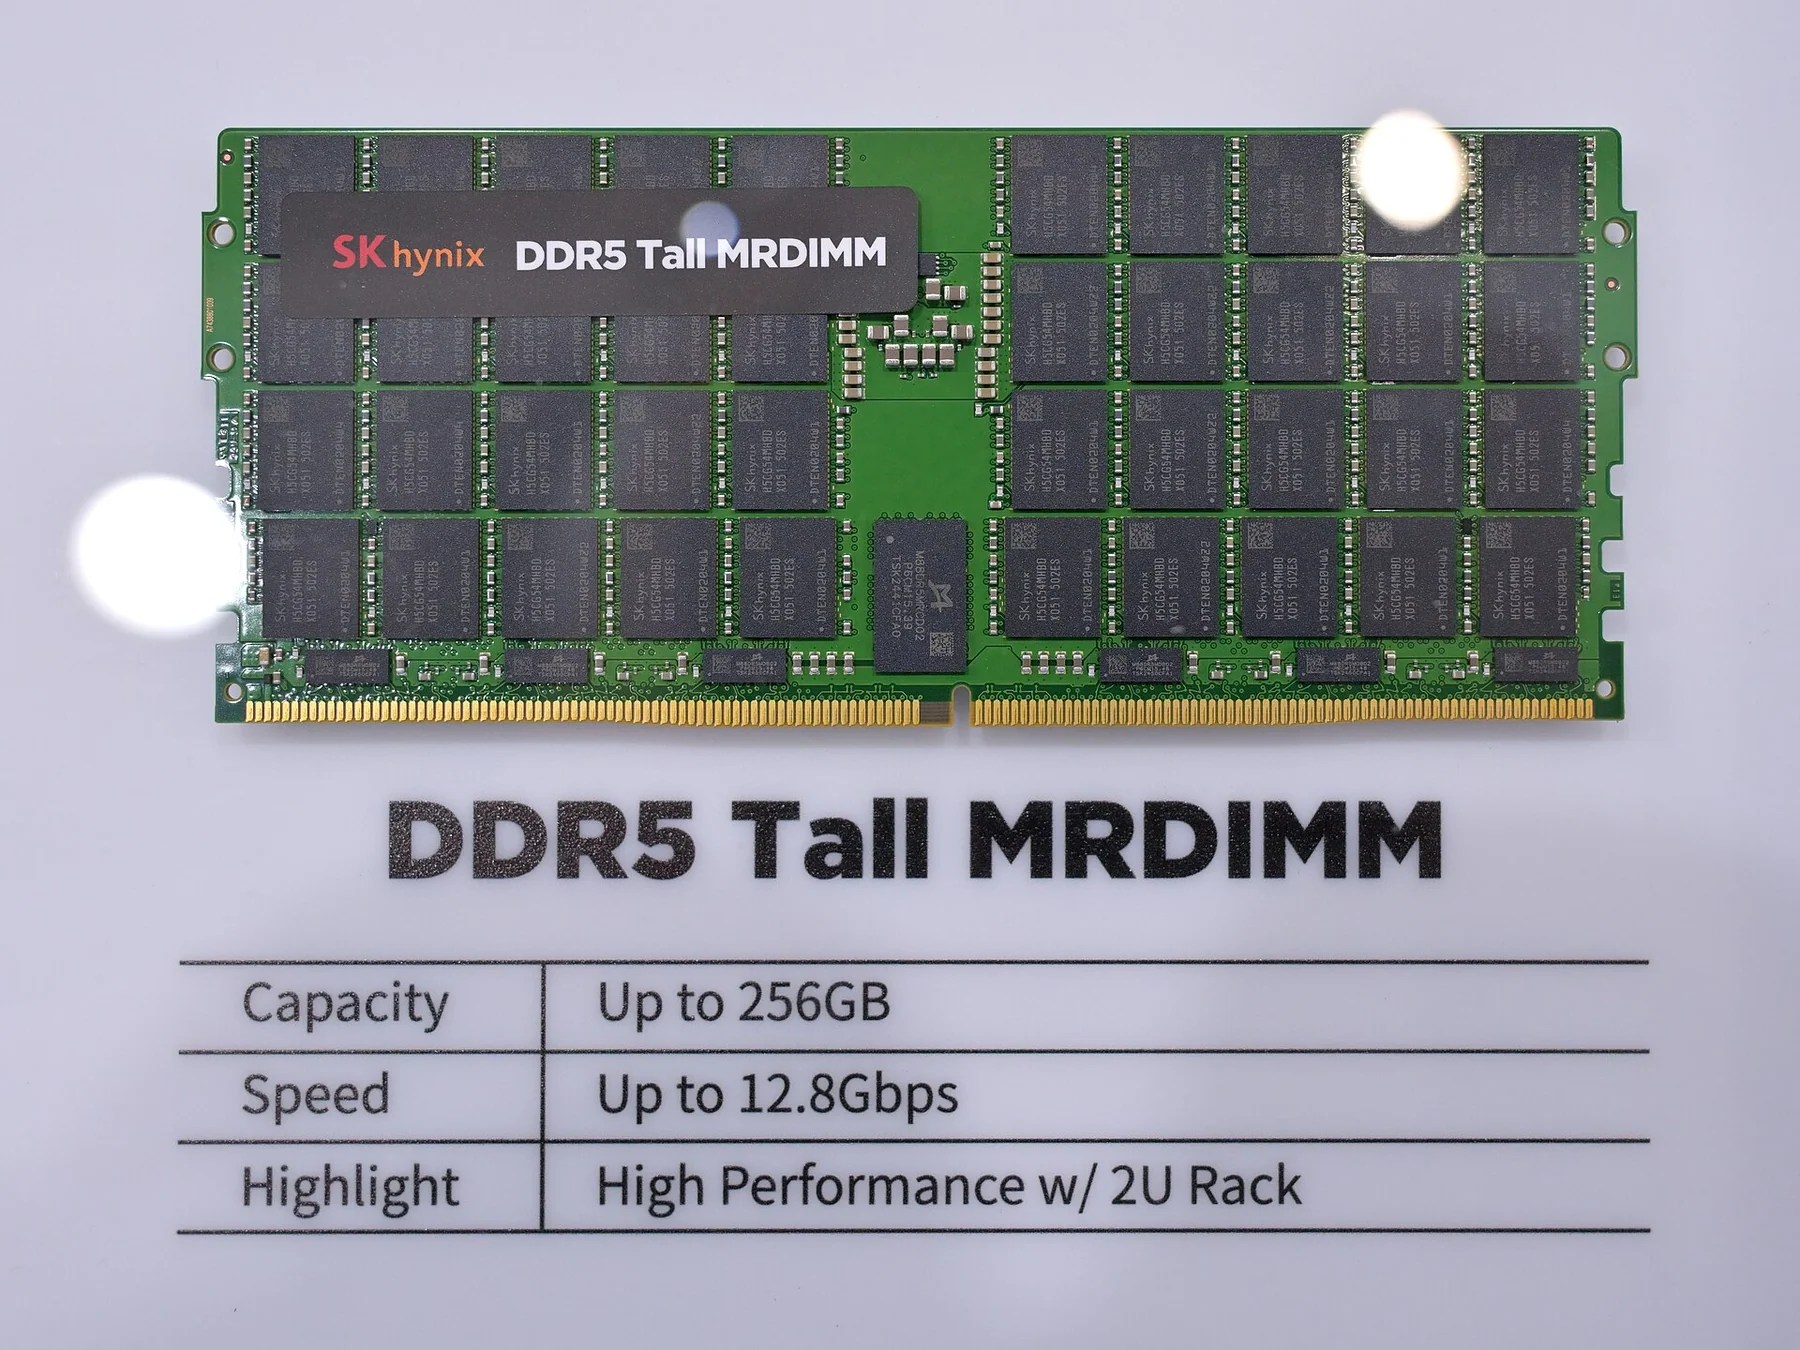
Investment interpretation.
Korean participation in AI need not depend on owning a consumer application. Memory can capture spending before the application layer has proven its profitability. But scarcity pricing and durable pricing power are different propositions. Our credit lens asks whether the qualification process and production capability survive a reversal in the supply cycle, rather than capitalizing one unusually profitable year indefinitely.
Economic assessment.
Start with operating profit, then deduct the cash required for fabrication, packaging, working capital and taxes. Stress the selling price and utilization together: a lower margin combined with new fixed capacity is more consequential than either variable alone. Consolidated profitability does not identify cash available to a particular financed asset.
47.2063 / 97.1467 × 100DSML calculation from the reported KRW figures. Approximately 48.6%; the company rounds to 49%. It is not a fund yield or free-cash-flow margin.
Geographic analysis.
China
DSML comparisonSeparate Chinese end demand from permitted delivery routes. Customer location and manufacturing location can create different trade exposures; this release does not quantify China revenue.
Japan
DSML comparisonExamine materials and equipment dependencies as well as potential customers. A diversified customer book may still depend on a concentrated input chain.
Other Asia
DSML comparisonMap packaging, fabrication and collection counterparties separately. Regional manufacturing capacity is not evidence that Korean issuers receive all downstream system margins.
United States
Reported connectionThe release identifies advanced packaging construction in Indiana. Local presence adds execution obligations; it does not by itself fix customer concentration or future demand.
Europe
DSML comparisonEuropean deployment offers a demand comparison, not a disclosed sales segment here. Check currency, delivery obligations and pricing separately before modeling regional receipts.
Counterpoint.
If rapid competitor expansion removes the supply bottleneck, record margins could normalize even while total AI spending rises. Volume growth alone would not refute that risk.
Underwriting questions.
- What cash remains after committed capital expenditure?
- How much revenue depends on repeat customer qualification?
- Which price and utilization combination breaks debt coverage?
Primary sources.
- SK hynix / FY2025 results2026-01-28
Analysis dated 8 October 2026. Event figures retain the period and status of their source. Announced commitments, conditional milestones, distribution reach and audience metrics are not realized investment returns. This research is not a recommendation or a representation of fund holdings.